Overall Architecture
The architecture consists of the following components:
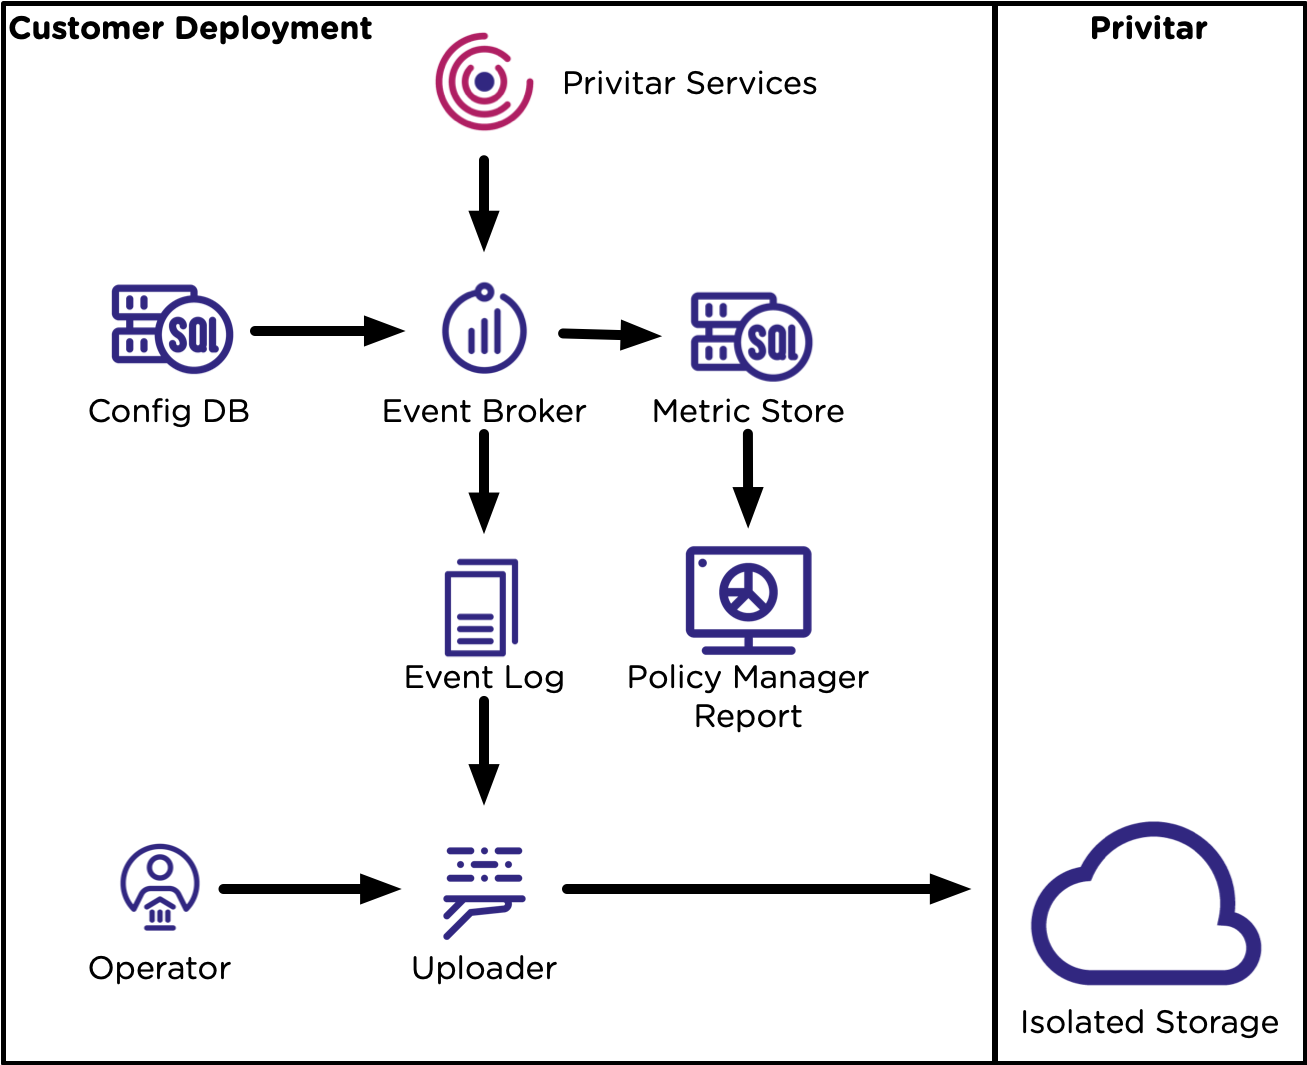
An Event Broker that collects events that have been produced as a result of various tasks being undertaken on the Privitar Platform. Events are collected in two ways:
Events are sent directly to the Event Broker from various services running on the Privitar Platform (Privitar Services).
The Event Broker runs a background service that queries the Privitar Policy Manager configuration database (Config DB) to gather data about Jobs that have been run and any additional audit data that has been generated.
Event data from the Event Broker is copied to two storage locations:
An Event Log containing the events that have been collected by the Event Broker regarding the usage of the Privitar Platform. The events are written to the Event Log in JSON format.
A Metric Store that stores aggregated metric data about the usage of the product. This data is presented as a report that can be accessed from Policy Manager.
A command line tool (Uploader) that is used to upload the Event Log files produced by the Event Broker to a Privitar-owned, secure data store (Isolated Storage). The type and location of the data store is agreed with the customer.
The process for running the Uploader is managed and can be configured by the customer (Operator). To ensure that no data leaves the customer environment without the consent of the customer, the Uploader is configured by default to be triggered by the designated operator at the customer premises.
These components work together to form a two-step process of collecting the event data and subsequently uploading the data to a Privitar data storage location.
Both steps are performed separately and asynchronously.
The operation of these components is shown in the diagram below:
 |
From the customer side:
Data is generated by Jobs running from any Privitar Platform, including the Batch Processor running on Policy Manager, together with jobs generated from POD, Data Flow Jobs (NiFi) and from the SDK.
From the Policy Manager, the customer will be presented with a screen showing aggregated figures for Privitar de-identification operations and other figures indicating overall usage of Privitar.
From the Privitar side:
Data received from the Telemetry Uploader is stored in a Privitar-owned secure storage, such as an Amazon AWS S3 bucket. Depending on customer policy, the Uploader will run periodically, will retry on failure and remove files from the Event Log when they have been successfully uploaded.
Privitar will use data analytics tools to analyze the data returned from the customer site.