Managing Service Health
The Service Health page displays status information about the general health of any services that are connected to the Privitar platform. The services that can be monitored are:
NiFi
Kafka
StreamSets
Privitar-On-Demand (POD)
Privitar SDK
The status information that is shown refers to whether or not the service is able to connect to the Privitar Event Broker which is used for logging the usage of the system. (For more information about the Event Broker, see Managing Service Usage.)
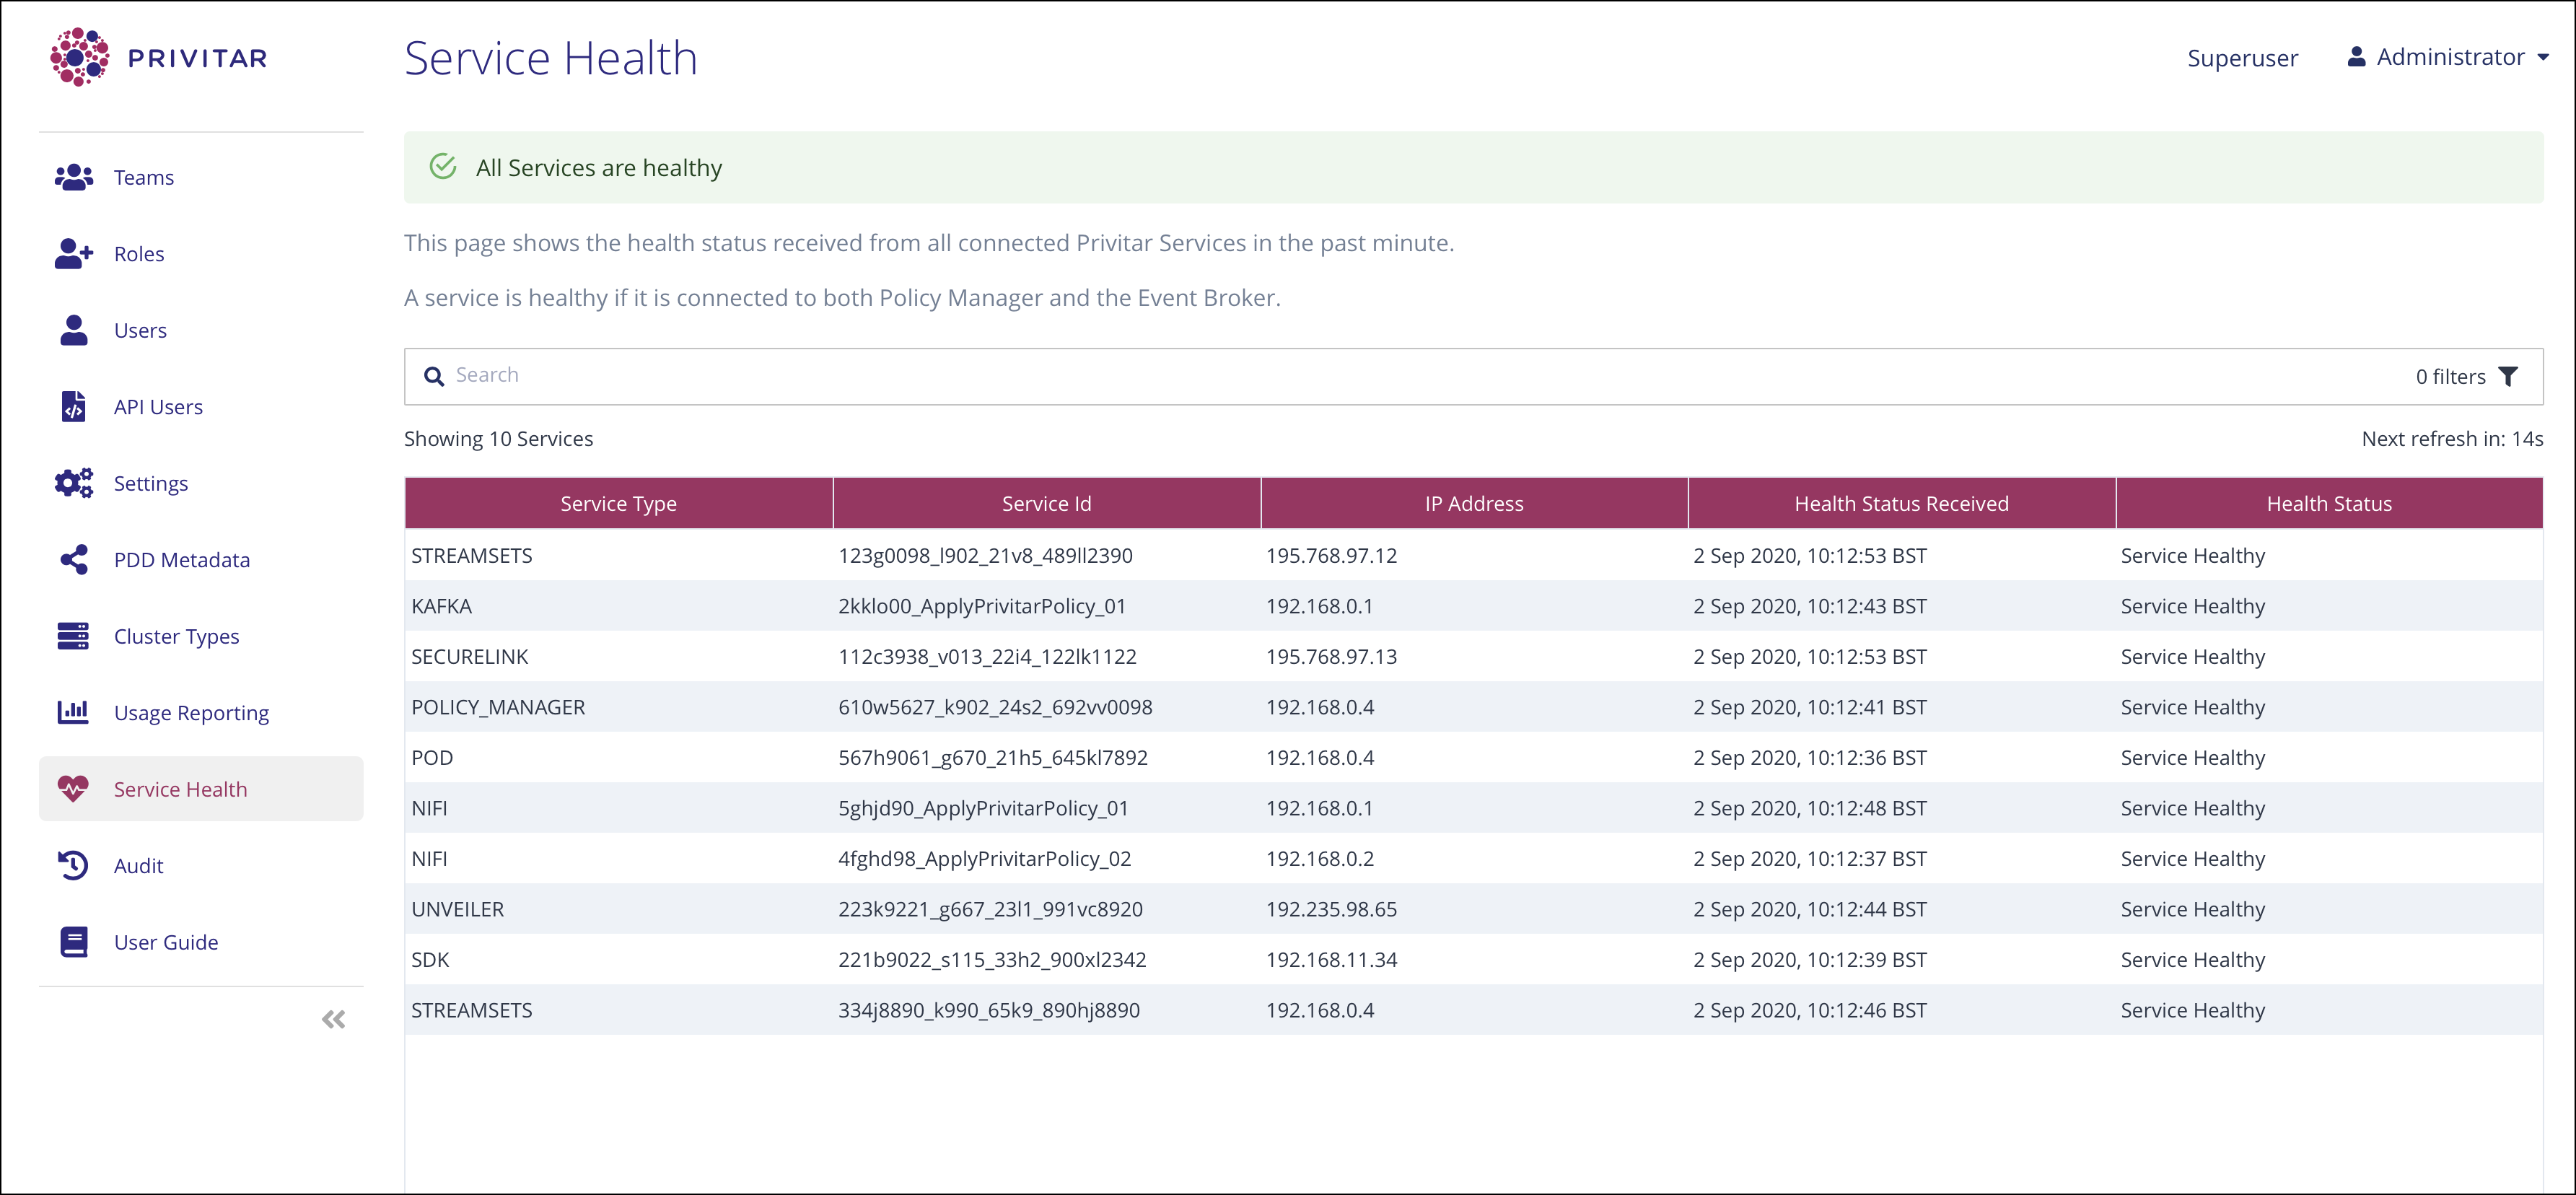
The information displayed for each service is:
Service Type - The service type.
Service Id - The Id of the service.
IP Address - The IP address of the service.
Health Status Received - The time and date that the health status of the service was last received.
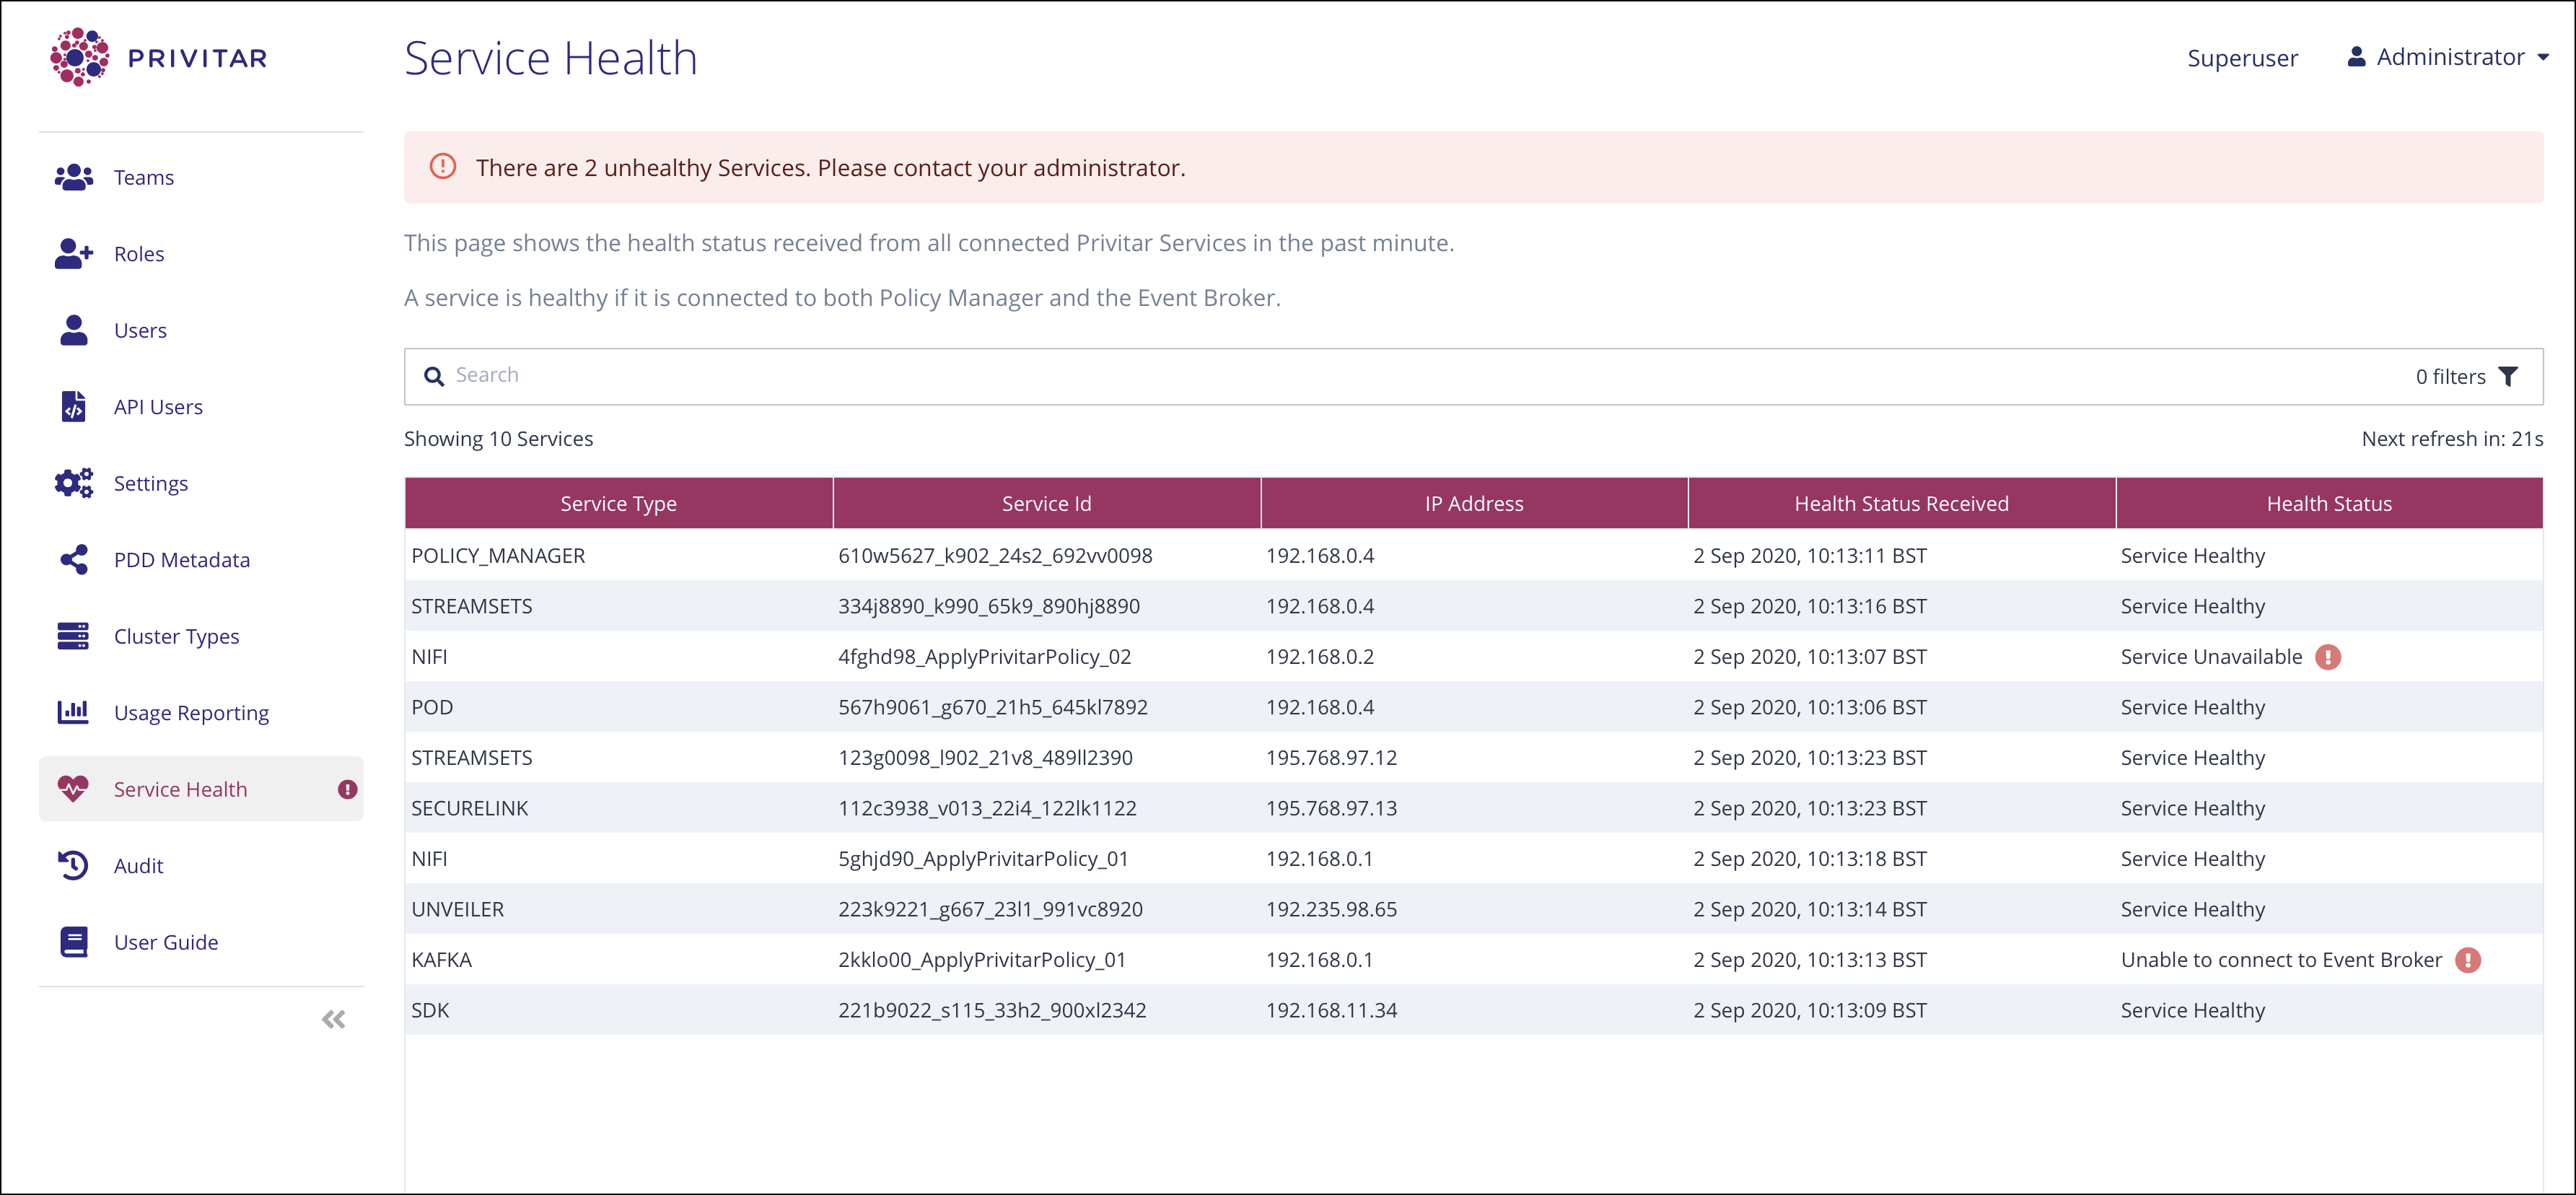
Health Status - The status of the connection between the service and the Event Broker. This can be any of: Service Healthy, Service Unavailable, Unable to Connect to Event Broker.
The status information for each service is updated every 30 seconds.
The page is available to Superusers in the Superuser Administration section of Privitar. If all connected services are healthy, a green notification banner is displayed at the top of the page:

If there is a problem with any of the connected services, the notification banner will turn red and an error icon will be displayed alongside the unhealthy services:

An error icon will also be displayed on the Service Health navigation button so you can see the status of the services at any time that you are using Privitar.
It is possible to filter the entries shown in the table so that you can view just the services or attributes that you are interested in. For example, you might want to view the health of one specfic service, not all the services.
To apply a filter:
Click on the filter icon. The Filter dialog box is displayed.
Edit the dialog box to select the services or attributes that you want to display.
Click on Apply. The filter is applied to the table and filter buttons are displayed to indicate that a filter is active.
