
Managing Service Usage
The Usage Reporting page tracks and logs information about daily usage of the Privitar platform. By default, the table displays usage data per day for the past month.
The page is available to Superusers in the Superuser Administration section of Privitar. For example:
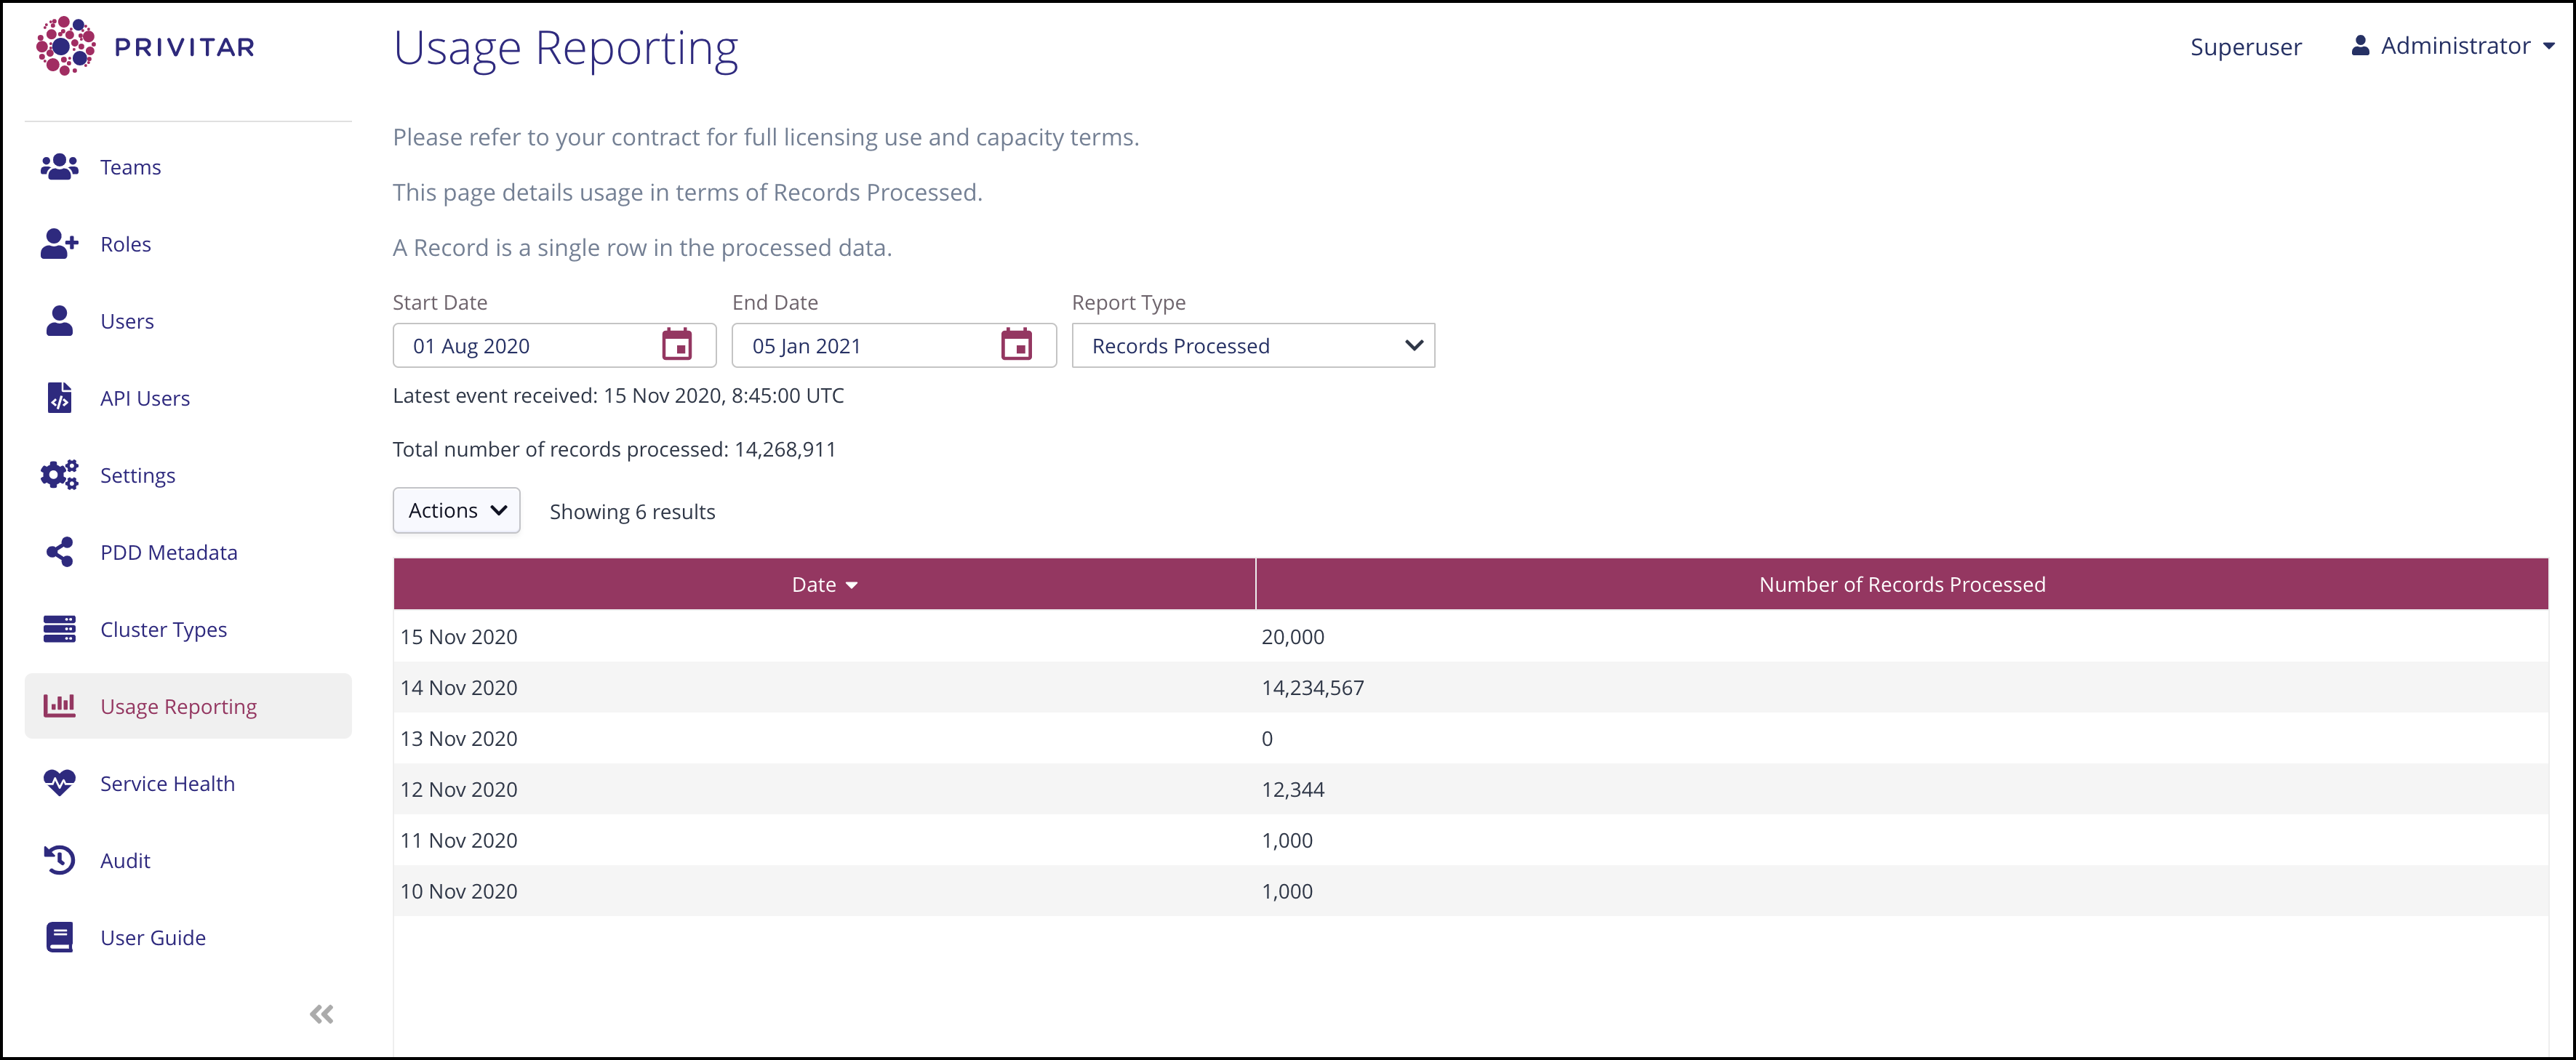
Privitar usage can be quantified using two different metrics:
As an aggregate number of Privacy Preserving Operations (PPOs) per day. A PPO is defined as any rule that has been applied to a field, but excludes:
A field in a column with a Drop Column rule applied.
A field in a column with a Retain Value rule applied
Both of these rules are passing through the data and not performing any sort of masking operation, so they are not considered as PPO operations.
As an aggregate number of records processed. A record is a single row in the processed dataset.
The Report Type list box determines the type of service usage that is displayed.
A single entry in the usage summary table corresponds to an aggregate view of either the (total) number of PPOs used or the (total) number of records processed, across all Teams that were set up on Privitar for that day of usage.
The page also contains information about:
The Latest event received. That is, the latest event received that details the daily aggregate count of PPOs or records processed.
The Total number of PPOs or the Total number of records processed for the current time period specified in Start Date and End Date.
A number of actions are available from this page that enable you to customise the view of the usage data:
Click on Date in the usage table to sort the usage records in ascending order (oldest first) or descending (latest first) order.
Click on the second column (Number of Records Processed or Number of PPOs) to sort the entries in ascending order (lowest number of PPOs or records first) or descending order (highest number of PPOs or records first)
Use the Start Date and End Date date pickers to view the usage data for a specific time period. The table will be updated to show the usage data over the selected period. The Total number of PPOs or Total number of records summary information is also updated to reflect the new time period.
For futher analysis of the usage data, you can also download a usage report for either the number of PPOs or the number of records processed. To download a CSV file of the current usage data displayed on the page, select Actions > Download. The downloaded file name and the column headings in the downloaded file will reflect the report type selected.
No records on this page can be edited or deleted.